Debug React Native Application
When doing application development with interactivity, UI/UX and state, on a resource-limited platform, these questions often come up:
Debugging — how do you debug applications?
Inspecting — how do you inspect the UI tree?
Touchables — how to understand interactive surfaces?
Platform — how to reason about the “magical things” that happen out of sight?
Slowness — how to get visibility about what’s slow?
Layout — Specifically, about React — how to reason about React performance and efficiency?
This is an overview of what’s available to you within React Native and its ecosystem.
Debugging
Debugging is seamless. You can debug Javascript, step into native, back to Javascript without configuring anything, and relying on Chrome devtools pointed at a debug interface that belongs to React Native.
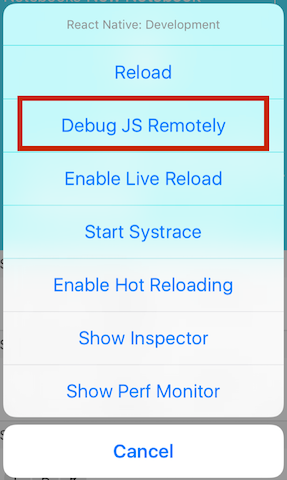
Cmd+Z (or shake) to bring up the dev menu.
Select ‘Debug JS Remotely’.
A fresh Chrome instance will pop up, which you can immediately use for setting breakpoints and stepping through your app’s Javascript code.
Remember to turn off remote debugging when done, by accessing the developer menu again (Cmd+Z).
Using console.log, or “console.log debugging” is also very common. It might seem a bit primitive, however with time console.log became a rather powerful tool for the Javascript developer, and it definitely isn’t equal to a dirty-feeling puts/print/cout/what-have-you.
Even if React Native doesn’t support the more advanced time, group, table interface, it would pop a yellowbox on warn, for example. React Native promotes a very fast feedback cycle, and using console.log rhymes better with that, rather than stop-the-world debugging and having to context switch — getting out of the editor and using a completely different toolset.
NOTE: There’s also Systrace, but given that it is quite low-level, we’ll cover in its own article.
Reactotron
If you haven’t already, go ahead and try Reactotron now. If you’re like me, you can’t get enough of command-line tools, and this one is one of the best you can use around React and Redux.
Reactotron plugs into your Redux pipeline as a middleware and lets you inspect, fiddle and trace it with a live ncurses based interface which is really fun to use.
Inspecting
Much like in Chrome’s devtools when inspecting the DOM for regular web pages, you can enable live inspection of React Native components.
Cmd+Z (or shake) to bring up dev menu.
Select Inspector.
Tap on ‘Inspect’.
You can now proceed to select a component, drill down or up the UI tree hierarchy by tapping the breadcrumbs pieces, and verify positioning, margins, padding and more. You can use this to find overlapping areas, surfaces that block event bubbling, transparent surfaces that overflow the existing viewport, and more.
Touchables
Showing areas that are touchable (users can tap those) can be useful when the interface is seamless and does not expose a clear border region for each touchable.
You can expose these with the inspector as well:
Cmd+Z (or shake) to bring up dev menu.
Select Inspector.
Tap on ‘Touchables’.
You can then hide the inspector and continue interacting with your application while every touchable is exposed. Crushed border line, color depicts type of touchable:
Spying on the Bridge
In a very high-level view, the architecture of React Native is divided into user code and platform code. User code, is typically your application Javascript code, and platform code is typically a mixture of Native and Javascript code as part of React Native. These two parts communicate over the React Native bridge.
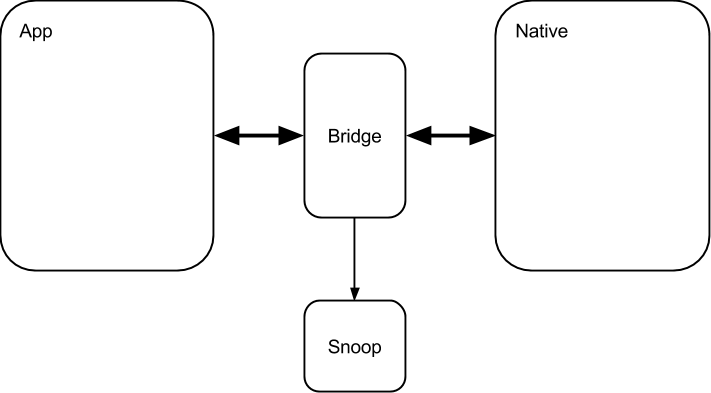
There’s a lot to gain by simply looking at these communications. You could find bottlenecks (by identifying too much chatter over the wire), resource hogs (by observing very large objects passing back and forth), bugs (by finding misplaced communication, forgotten timers, and so on) and more.
React Native comes out of the box with a special SPY_MODE flag that you can turn on in its MessageQueue component; through which these kind of communications pass. However, this was not exposed to end-users, but for React Native developers. I wanted to change that with this pull request, by allowing end users to plug in their own “spies”.
I then proceeded to build a spying framework which you can use today called Snoopy.
And here’s how it looks like:
With Snoopy, you can build sophisticated bridge event pipelines using the powerful Reactive Extensions and FRP concepts that declaratively model what you want to observe and detect, instead of how you want to detect it.
Here are some ideas for things you can observe over the bridge with Snoopy:
Buffer events for one second, and raise an alert when the total events cross a threshold.
Identify huge calls by looking at the arguments for each event.
Keep an eye open by charting out the bridge communication volumes.
Check out the Snoopy repository for more.
Update: I published an in-depth article about using Snoopy!
Slowlog
Many databases implement a feature called a “Slow Query Log” or simply “slowlog”, which is a file that the database uses to log very slow queries. An administrator can simply tail this file, and/or ship it to a log aggregation service that notifies her when a slow query happens.
I wanted to have this same concept for React Native applications.
With react-native-slowlog, you wire such a capability into your React components piecemeal, and get a high-level idea in real time of the slow things that happen around your app. It is not a fine-grained diagnostics tool, but rather a general watchdog that sits there and pops an alert when things are majorly slow.
You can find out more about slowlog in the react-native-slowlog repository.
JSEventLoopWatchdog
Here’s a neat idea: if you set a Javascript timer to fire every second, and on every tick you look at the wall clock to make sure that exactly one second has passed, then you can detect if your Javascript code is running late.
This idea is exactly what the JSEventLoopWatchdog component in React Native core does. It Detects stalls in the React Native Javascript event loop by scheduling a no-op task every X amount of time, recording the wall clock time it executed at in reality, and compares it to the expected time. If we have a stall, there will be a difference in clock times. The bigger the stall the bigger the difference.
To use JSEventLoopWatchdog, you supply a threshold time — the duration, in milliseconds, equal to the lag you’re willing to accept. When the lag is bigger, you’ll get console messages notifying you about it:
The bad news is that this is still an internal tool React Native uses since it’s not currently usable if you’re out of the react-native project space. The good news is that I’ve extracted it into react-native-slowlog and adapted the internals so that it can run outside of the react-native core.
To use JSEventLoopWatchdog on your own, you need to use the watchdog component of slowlog:
Now, if anything is stalled for more than 50ms, you’ll get a notification in your logs.
React Perf Tools
Last but not least, remember you still have all the vanilla React tooling available. The official docs makes a better explanation than I would ever make here, so I’ll just point you to it:
Last updated
Was this helpful?